Take the faster path to growth. Get Smith.ai today.
Affordable plans for every budget.


That customer who hung up after waiting six minutes? They're already checking out your competitor's website.
Your call center isn't just taking calls. It's either building or destroying your brand reputation with every interaction. The truth is that 52% of customers in the US and UK will abandon you for a competitor after one poor service experience, while 90% say response time makes or breaks their satisfaction.

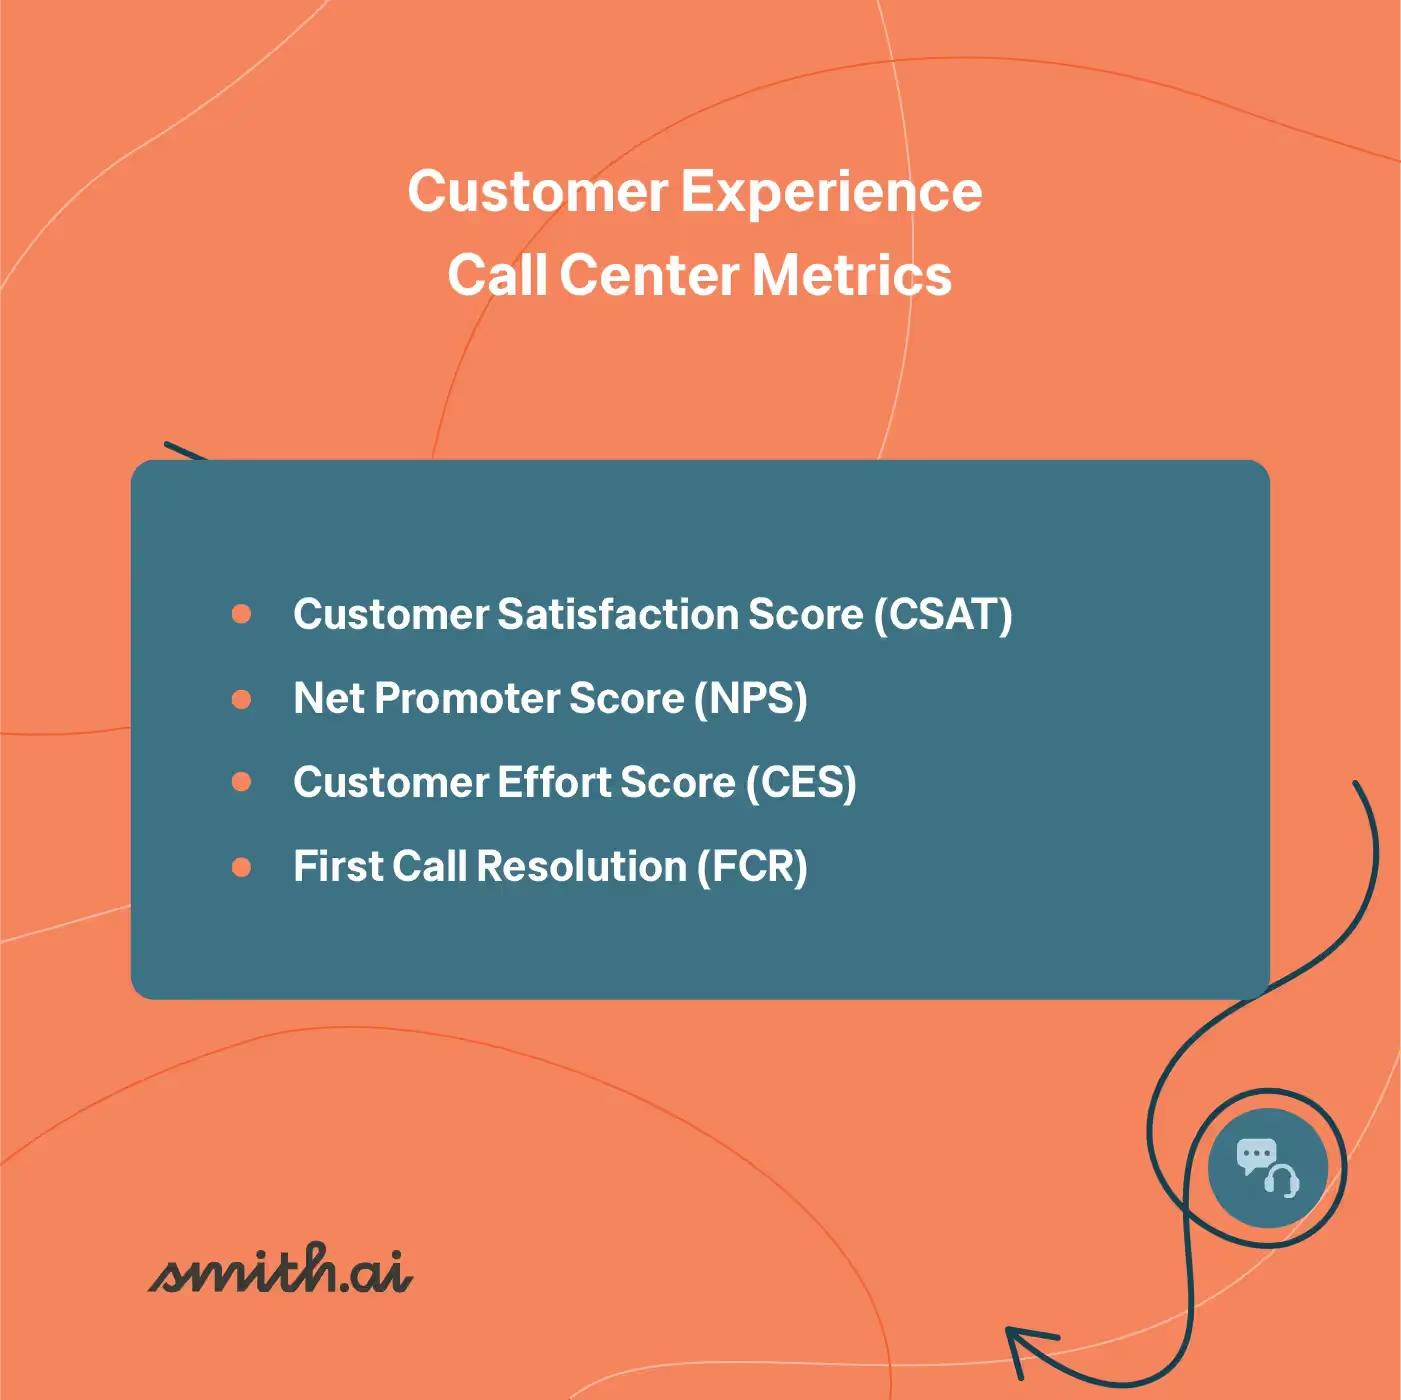
To optimize your call center operations, we'll explore metrics in three categories:
Customer experience metrics translate feelings into numbers. They quantify how people feel about your brand, measuring sentiment and satisfaction, showing whether customers might buy again or recommend you.
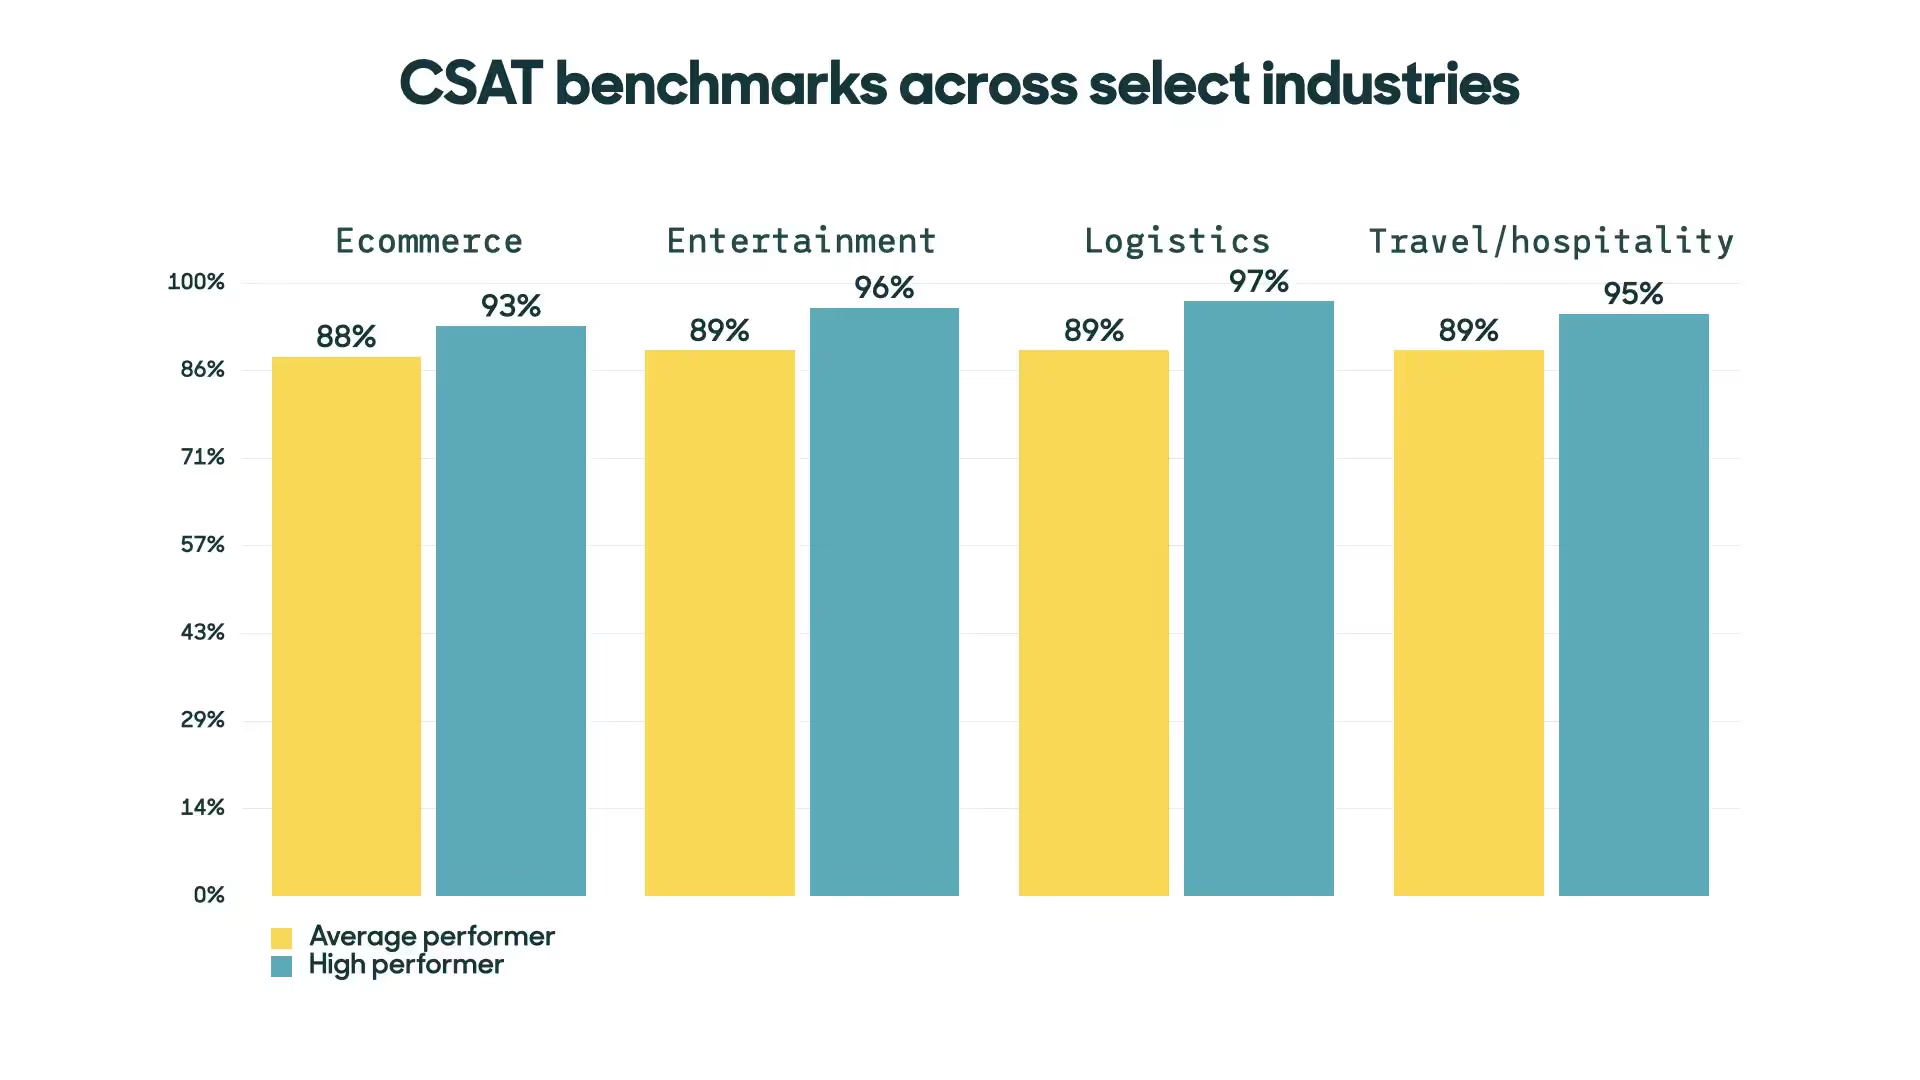
Tracking these metrics over time establishes benchmarks and shows your progress compared to industry standards. Let's explore the most important customer experience metrics to keep your eye on.
CSAT measures how satisfied customers are with a specific interaction, product, or service, capturing satisfaction at different points in their journey.
CSAT surveys typically ask: "How satisfied are you with [blank]?" You can customize this to evaluate different aspects of support, software updates, or purchases.
How to calculate CSAT:
If 75 out of 100 respondents report being satisfied, your CSAT score is 75%. Scores above 50% are generally good.
The real power of CSAT is its ability to identify satisfaction at specific moments and "close the loop" with customers:
NPS assesses customer loyalty and predicts business growth. Many top companies use NPS to compare performance against competitors.
The NPS survey asks: "On a scale from 0-10, how likely are you to recommend our company to a friend or colleague?"
Based on responses, customers fall into three groups:
How to calculate NPS:
NPS = % Promoters - % Detractors
If 60% are promoters and 10% are detractors, your NPS is 50. Scores range from -100 to 100.

NPS stands out for its:
For best results, send NPS surveys quarterly or bi-quarterly with a comment box for details.
Customer Effort Score measures how much work customers need to do to get issues resolved or questions answered. The idea is that customers value easy interactions as much as or more than exceeding expectations.
A typical CES survey asks: "On a scale of 'very easy' to 'very difficult', how easy was it to interact with [company name]?"
How to calculate CES:
CES = Sum of all customer effort scores / Number of customers surveyed
Lower scores mean less effort required from customers. CES works well for assessing specific touchpoints like customer service interactions, checkout processes, or product setup experiences.
By finding high-effort areas in your customer journey, you can focus improvements where they'll have the biggest impact on satisfaction and retention.
First Call Resolution measures the percentage of customer inquiries resolved during the first interaction, without needing follow-up.
How to calculate FCR:
FCR = (Number of issues resolved on first contact / Total number of first contacts) × 100
A high FCR rate shows efficient and knowledgeable support, leading to:
To improve FCR, make sure your support team has:
By tracking these customer experience metrics, you'll gain valuable insights into customer perceptions and find specific areas to enhance satisfaction and loyalty. These metrics work best together, as each shows a different aspect of the overall customer experience.
When you track agent performance metrics, you're not just gathering numbers — you're creating a roadmap for improvement. These metrics evaluate individual agent work and show how well your operations function. Let's look at three critical metrics that directly affect your contact center's success.
Utilization rate shows the percentage of time agents spend interacting with customers or being available during paid work hours. Think of it as your productivity barometer.
To calculate:
Utilization Rate = (Total Login Time / Total Paid Time) × 100
For example, if an agent has 350 minutes of login time and 480 minutes of paid time:
(350 minutes / 480 minutes) × 100 = 73% utilization rate
Components of this calculation:
Industry standards suggest a target between 75% and 85%. Rates above 85% may cause burnout, while rates below target might indicate inefficient resource use.
To improve utilization rates, review scheduling practices, optimize training sessions, and address adherence issues.
Average Handle Time measures the duration from when a customer initiates contact until the interaction ends, including hold times, transfers, and after-contact work.
The formula is:
AHT = (Talk Time + Hold Time + Wrap-up Time) / Total Number of Calls
AHT needs careful interpretation. Long handle times might show struggles with resolving issues, while very short AHTs could mean rushing through interactions without fully addressing customer needs.
To effectively manage AHT:
Remember that AHT can mislead if you focus only on reducing time without considering resolution quality.
Adherence to Schedule measures how consistently agents follow their assigned schedules, affecting service levels and team morale.
To calculate:
Adherence % = (Time in Adherence / Scheduled Time) × 100
Time in adherence means periods when agents are doing what they're scheduled to do.
Poor schedule adherence can cause:
To improve schedule adherence:
By tracking these key agent performance metrics, you can create a more efficient contact center that balances operational needs with agent wellbeing and customer satisfaction.
Operational efficiency metrics help you measure how well your call center balances cost management with service quality. Think of these metrics as your financial vital signs—they show the health of your operation and guide data-driven decisions.
Cost per Call (CPC) measures the average cost of handling each customer interaction. It's your call center's ROI report card, showing exactly how efficiently you're operating.
To calculate CPC, add up all contact center expenses, including:
Then divide this total by the number of logged call minutes over a specific time period. You can calculate this for your entire call center or break it down by individual agents and queues.
A lower CPC indicates more efficient resource usage. By comparing revenue per call against cost per call, you can determine if your call center uses call time efficiently.
It's important to distinguish between "cost per contact" (expense of each interaction) and "cost per customer acquired" (expense related to successful conversions).
Service Level measures the percentage of incoming calls answered within a predetermined time frame, such as answering 80% of calls within 20 seconds.
This metric directly affects customer satisfaction by showing wait times and responsiveness. When service levels drop, hold times increase, causing customer frustration.
The formula is:
Service Level = (Number of Calls Answered Within Threshold / Total Number of Calls) × 100
For example, if your target is to answer 90% of calls within 30 seconds, your service level would be recorded as 90/30 when you meet that goal.
To improve your Service Level:
Agents can use service level data to prepare for potentially frustrated customers during high call volume periods.
Call Arrival Rate measures the number of incoming calls your contact center receives over a specific timeframe, essential for forecasting demand and ensuring appropriate staffing.
You can measure call arrival rate in various intervals:
Most call centers report this metric daily, dividing the total number of calls by the total time in the workday.
Understanding call arrival patterns helps you:
This metric works with other indicators like agent availability and first response time to determine if your call center has enough staff to meet customer demand.
By monitoring these operational efficiency metrics, you can find opportunities to reduce costs while maintaining or improving service quality.
The call center landscape is changing rapidly, and if you're still relying solely on traditional metrics and tools, you're already falling behind. Technology integration isn't just a nice-to-have — it's become crucial for success in modern customer service.
AI is revolutionizing quality assurance by providing unprecedented insights into customer interactions. While human QA teams typically review 1-2% of calls, AI-powered quality assurance can review 100% of support interactions, finding patterns that would otherwise go unnoticed.
Voice assistants' adoption is particularly noteworthy, with more than 8.4 billion units expected to be in active use worldwide by 2024. This is driving greater implementation of natural language processing (NLP) and machine learning technologies in call centers.
Sentiment analysis tools are becoming indispensable, with nearly 95% of customer interactions expected to be processed through these tools by 2025. This technology enables call centers to gauge customer emotions in real-time, allowing for more empathetic responses.
Automation of routine tasks allows agents to focus on more complex customer needs. This improves efficiency and enhances employee satisfaction by eliminating mundane tasks. Think of it this way: when agents aren't bogged down with repetitive processes, they have more mental bandwidth for actual problem-solving.
AI-led, human-backed call handling provides agents with instant access to relevant information during live interactions, offering several benefits:
Cloud-based contact center solutions are experiencing tremendous growth, with the market projected to reach $82.43 billion by 2030. These virtual contact centers offer flexibility and scalability, with the remote agent workforce expected to grow by 60% from 2022 to 2024.
Comprehensive call center software is essential for tracking both operational metrics and customer experience data, enabling more targeted improvements through holistic performance management.
The omnichannel customer engagement market is expanding rapidly, with projections indicating growth to $17.92 billion in revenue. These solutions ensure consistent customer experiences across all communication channels.
For call centers looking to improve performance metrics, investing in these technologies offers a clear path to enhanced efficiency and customer satisfaction. The difference between industry leaders and laggards often comes down to not just what each call center knows, but how they make use of that knowledge.
Call center success comes down to tracking the right metrics and taking smart action. Your numbers tell a story about customer satisfaction, agent performance, and operational efficiency.
The AI Receptionist from Smith.ai helps improve these crucial metrics by ensuring your business never misses a call, capturing valuable interaction data, and handling routine inquiries while your team focuses on complex customer needs.
Book a free consultation with us and see how Smith.ai can help your business.

Maddy Martin is Smith.ai's SVP of Growth. Over the last 15 years, Maddy has built her expertise and reputation in small-business communications, lead conversion, email marketing, partnerships, and SEO.


%20(1).avif)

